
Tags
career, CDE, college, community, competitiveness, Dashboard, global, growth, indicators, LCAP, outcomes, Strategic Plan, success
Dear Bonsall School Community,
Whether it’s sports, politics, weather, or education, we are living in historic times of very surprising outcomes! As a school community, it’s the education issues we focus on for “Academic excellence and support for all students to be highly competitive in their chosen career path and college”. Traditionally, public education has taken a strong emphasis on preparing students to be successful in school, with the hope this translates to success in life. Today, our State standards, assessments and accountability, and funding model are all being aligned to prepare students for not just college, but also their careers. The achievement gap in schools is more of an opportunity gap linked to poverty than ethnicity or zip codes. Today’s global competitiveness is based on more countries realizing that education is the key to a more productive workforce, economy, government, military, and society in general.
As we pass the mid-point in the school year, we are looking closely at the success indicators in our Strategic Plan. The Local Control Accountability Plan (LCAP) depends on the data we shared with the Board of Trustees at our February board meeting. We have always met our LCAP goals, and over the next couple months the California Department of Education (CDE) will be sharing a new “Dashboard” of the various indicators that create great schools. No longer will schools only be ranked on their academic test scores alone. A more complex accountability system will also measure indicators like attendance, suspension/expulsion, graduation rates, English learner progress, and college and career readiness. Public access to our District dashboard is anticipated to be available in March.
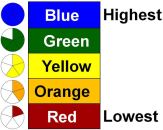
This more sophisticated measuring of schools using multiple success indicators will be based on change as well as status. The “Dashboard” will reflect levels of blue as highest, then green, orange, yellow, with red being the lowest. A school or district might be highest in their status for a success indicator one year and show blue, but if they decline even by a single point the next year it will be indicated by green for that specific success indicator. Please follow this link to the California Department of Education’s website to view illustrations of a sample Dashboard. This graphic metric will help provide more depth in understanding of how to create better schools by providing deeper information of what is happening in schools and the trajectory of improvement.
Our District philosophy is “Dedication to continuous improvement”, so this new accountability metric fits well with our school system because it, too, shows growth as well as status. Thank you for the opportunity to continually improve Bonsall schools.
Sincerely,
Justin Cunningham, Ed D
